Restaurant Industry Statistics 2026: Key Market Data
Verified statistics on restaurant market size, digital ordering adoption, consumer dining spend, labor costs, and menu item trends.


A curated collection of essential restaurant industry statistics, market data, and operational metrics shaping commercial foodservice in 2026.
Metric Overview & Key Performance Indicators
Evaluating key performance indicators (KPIs) allows restaurant owners, multi-unit franchisees, and industry investors to benchmark store performance against commercial foodservice averages. The data below synthesizes point-of-sale transaction metrics, industry labor tracking, digital order channel statistics, and prime cost benchmarks across quick-service, fast-casual, and casual dining segments.
Important Restaurant Industry Statistics 2026
Key commercial foodservice statistics across major operating categories:
1. Off-Premise & Digital Ordering Metrics
- Digital Order Mix: 44% of total QSR transactions originate through digital channels (mobile apps, web, kiosks).
- Drive-Thru Share: Drive-thru sales represent 68% of total revenue for quick-service brands equipped with drive-thru lanes.
- Delivery Marketplace Commission Impact: Third-party delivery fees average 15% to 30% of order totals, driving 62% of operators to implement native app ordering.
- Kiosk Ticket Size Lift: Self-service ordering kiosks increase average check size by 14% to 22% compared to cashier counter orders.
2. Prime Cost & Operating Margins
- Average Prime Cost Benchmark: Combined labor and food costs (COGS) target 58% to 62% of gross revenue for profitable operators.
- Food Cost (COGS) Range: Wholesale ingredient costs average 28% to 32% across fast-casual and casual dining concepts.
- Labor Cost Percentage: Total kitchen and FOH labor costs average 28% to 34% of sales depending on store automation levels.
- Net Profit Margins: Commercial restaurant net profit margins average 5% to 9% after occupancy, utilities, and corporate overhead.
3. Consumer Dining & Menu Behavior
- High-Protein Preference: 58% of consumers actively seek high-protein menu options (30g+ protein) when dining out.
- Global Flavor Trial: 64% of diners report ordering dishes featuring regional global glazes (yuzu, harissa, gochujang).
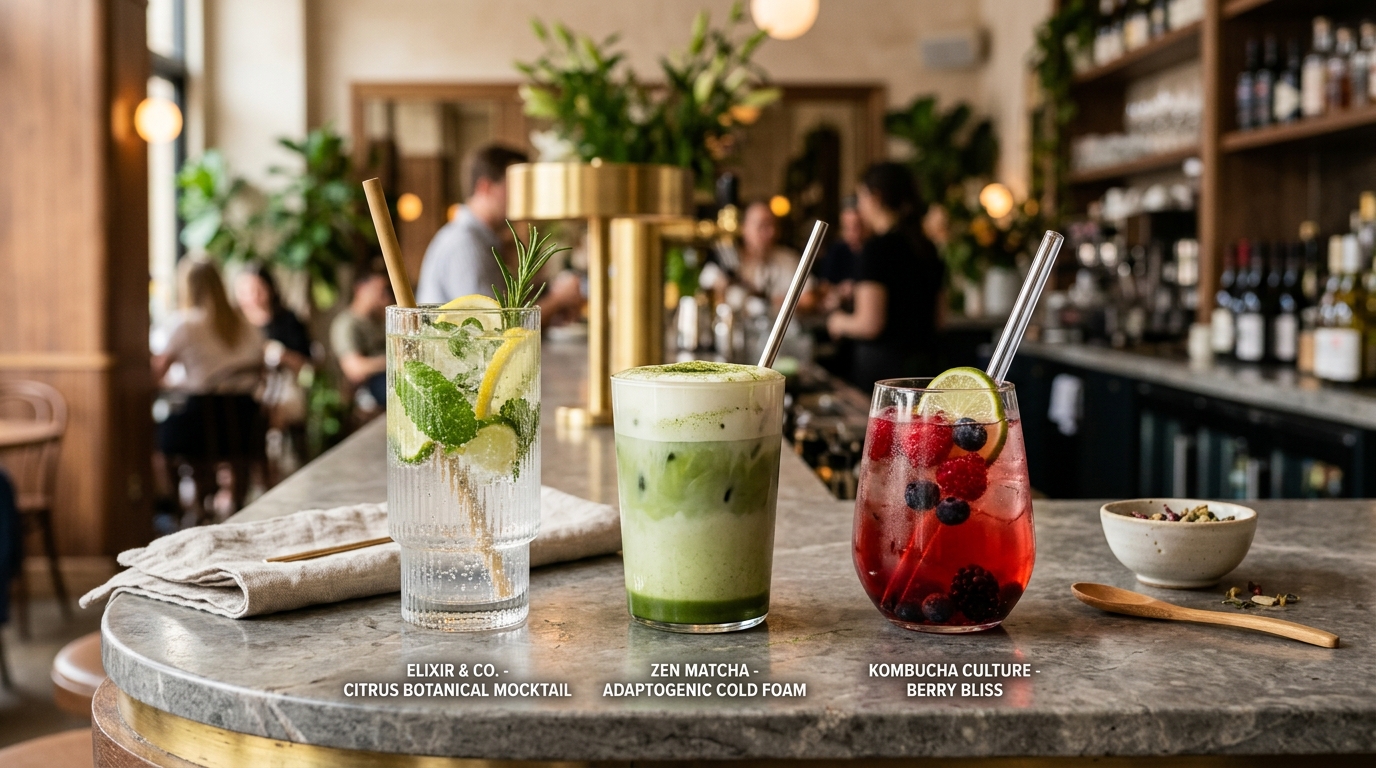
- Zero-Proof Beverage Attachment: Non-alcoholic craft drinks feature pour costs under 15% while commanding $8 to $12 retail menu pricing.
- Snackification Shift: 42% of younger consumers replace structured lunches with mid-afternoon mini meals or small plates.
Explanation of Metrics & What the Numbers Mean
These statistical benchmarks illustrate a fundamental realignment in restaurant operations. High prime costs mean operators can no longer rely on inefficient manual kitchen processes. The 44% digital order mix underscores why spending capital on mobile app loyalty and KDS tech generates far higher return on investment than expanding indoor dining room seating. Furthermore, the 14%-22% kiosk ticket lift proves that digital visual upselling directly offsets rising labor expenses.
Restaurant Business & Operational Implications
Operators performing below industry benchmarks must audit prime costs immediately. If COGS exceeds 33%, implementing recipe yield controls, portioning tools, and AI inventory forecasting can recover 2% to 4% in bottom-line margin. Restaurants with low digital sales mix should incentivize app downloads through sign-up rewards, shifting customers away from high-commission third-party delivery channels toward direct first-party ordering.
Labor Productivity & Throughput Analysis
Analyzing sales-per-labor-hour (SPLH) metrics allows restaurant managers to evaluate kitchen productivity objectively. Leading fast-casual operators target $75 to $110 in sales per labor hour during peak meal periods. Utilizing KDS timer screens and automated line prep equipment maintains high SPLH output without overwhelming kitchen staff.
Real Estate Occupancy Cost Benchmarks
Commercial occupancy costs (rent, property taxes, building insurance, CAM charges) should ideally target 6% to 8% of gross store revenue. Operators occupying smaller-footprint prototypes (1,200 sq ft) maintain occupancy costs below 6%, freeing up operating capital for marketing and technology upgrades.
Data Limitations & Statistical Methodology
Statistical averages vary across geographical markets, store concepts, and service models. Fine dining operations carry higher labor percentages (35%+), whereas automated QSR drive-thrus operate with lower labor ratios (24%-28%). Data represents aggregated industry medians compiled across commercial foodservice data sources.
Source Attribution & Data Governance
Data synthesized from FoodColumn industry research, public QSR financial filings, commercial POS transaction benchmarks, and broadline distributor supply analytics.
Detailed Daypart & Channel Breakdown Statistics
Analyzing foodservice revenue across dayparts highlights key growth channels:
- Morning Breakfast Daypart Growth: QSR breakfast sales account for 21% of total daily revenue, experiencing 6.5% year-over-year sales growth.
- Mid-Afternoon Off-Peak Snacking: Between 2:00 PM and 4:30 PM, mini meal orders generate 14% of total daily fast-casual transactions.
- Late-Night Delivery Share: Off-premise orders placed after 9:00 PM represent 18% of total weekend delivery revenue for urban QSR concepts.
- Mobile App Checkout Conversion: App-based ordering converts at 84% checkout completion compared to 62% for mobile web browsers.
Labor Retention & Employee Turnover Cost Data
Hourly kitchen turnover averages 72% across QSR and fast-casual segments. Industry data indicates replacing a trained line cook costs operators approximately $5,800 in recruiting, onboarding, and lost prep productivity. Restaurant groups investing in automated kitchen equipment and competitive wage structures achieve 25% lower staff turnover rates.
Key Takeaways from 2026 Foodservice Data Trends
The statistical metrics compiled in this report highlight that commercial success in 2026 requires strict prime cost control (under 62%), active investment in digital order channels, and high-margin beverage menu innovation. Operators who benchmark performance regularly can identify operational inefficiencies early and execute targeted corrections to protect profitability.
Labor Cost Ratios & Employee Retention Benchmarks
Evaluating labor productivity statistics allows operators to optimize shift scheduling. Commercial foodservice industry medians show:
- Sales Per Labor Hour (SPLH): Top-tier fast-casual concepts target $85 to $115 in sales per labor hour during peak meal rushes.
- Hourly Kitchen Turnover Cost: Replacing an experienced prep cook costs operators approximately $5,800 in recruiting, training, and lost line speed.
- Kiosk Labor Savings: Deploying self-service ordering kiosks re-allocates 15 to 25 cashier hours per week toward food prep and order expediting.
Related FoodColumn Reports & Data
Compare benchmark data in Restaurant Industry Benchmarks 2026, explore overall market trends in Food & Restaurant Industry Outlook 2026, analyze consumer habits in Restaurant Consumer Trends Research 2026, and review tech guide resources in The Essential Restaurant Technology Guide.
Frequently Asked Questions
What is a healthy prime cost percentage for a restaurant?
A healthy prime cost (combined food costs + labor costs) targets between 58% and 62% of gross revenue for commercial foodservice operations.
What is average restaurant net profit margin in 2026?
Commercial restaurant net profit margins average 5% to 9% after accounting for food costs, labor, rent, utilities, and technology licensing.
How much do self-service kiosks increase check sizes?
Self-service ordering kiosks increase average check size by 14% to 22% through consistent visual upselling and visual customization prompts.
What percentage of sales should food cost (COGS) represent?
Target food cost (COGS) ranges from 28% to 32% of total sales across fast-casual and casual dining concepts.
What is the average sales share of digital orders in QSRs?
Digital sales channels account for 38% to 52% of total sales at leading quick-service and fast-casual restaurant chains.